Renders the selected cell using, where possible, text labels or assigned Excel cell names, to define the referenced cells. If no name or label exists, then the cell will be represented with standard 'A1' Excel reference style.
Appearance
Names variables are shown in Blue by default (all color defaults can be changed in settings).
Function names, e.g. sin() or min(), are shown in Dark Red text by default.
Constant values, operators and other symbols are shown in Black by default.
Usage
fxRender will always try to associate a name to a cell that it wants to use in a formula, using a pattern matching algorithm, which selects the best possible label for a variable in this order:
A cell amongst a matrix of numbers, or which has a header identified in some way (i.e. bold, italic etc.).
The cell has been named using the inbuilt Excel naming system.
Text to the left of the cell that could be used as a label.
And any text above the cell that could be used as a label.
Where you have many numbers in a grid or matrix, it could be wrong for fxRender to infer a name purely based on what text exists to the left or above. For this reason the system
can be configured (see settings) to only use text that is either bold, italic, or which contains an operator or specified symbol.
When creating labels for cells you can also use the LaTeX mark-up to describe the variable, e.g. '\alpha + \beta'. fxRender switches to LaTeX notation whenever is see a ('\') within your label. One significant consequence of this is that spaces between words are no longer recognised, so to overcome this, put '\:' (a LaTeX space command) where you would otherwise want to include a space, as in
"hello\:world".
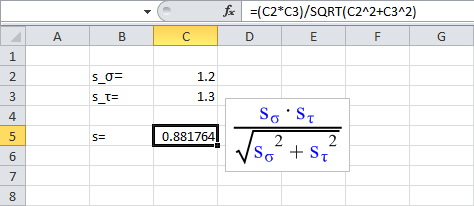
Select cell C5, which contains the formula "=(C2*C3)/SQRT(C2^2+C3^2)".
Click the Cell Name button.
The rendered equation will appear in the first empty space to the right of the selected formula.
Note: in order to show the symbols "σ" (sigma) and "τ" (tau) as an index of "s", use an underscore, '_', between the "s" and the symbol, e.g. 's_σ'. If you want multiple characters as part of the subscript, use '_{...}' as in "s_{word}". Equally, superscripts are produced using the caret, '^', as in 'x^2'.
Examples 3 - Working with Matrices
Select cell D8, which contains the formula "=F5*D5".
Click the Cell Name button.
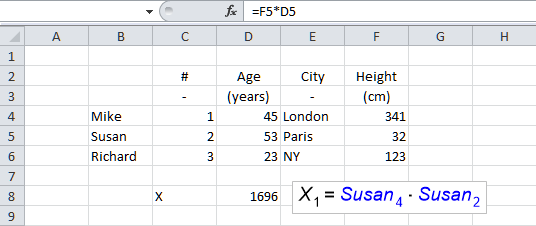
As this formula refers to elements within a table, fxRender is unsure which column or row represents a heading. In the current case, since the 'First Non Numeric Value' is selected in fxRender-Settings-Options, the tool uses the left most cell with text that is considered to be part of the data block forming the matrix, i.e. there are no empty cells between the chosen title and the referenced variable.
Since there are no detected column headings, fxRender uses a numeric subscript to indicate the relative offset of the referenced cell from the heading.
To explore this further, try deleting the word 'Susan' and repeat the above steps.
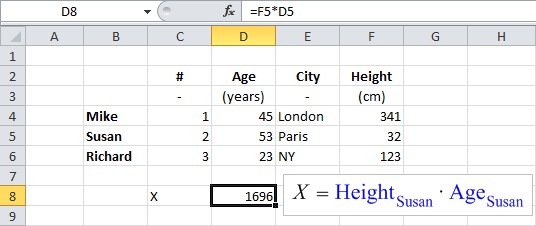
In this example the headings in both Row 2 and Column B are Bold.
Again, Cell D8 is selected and the Cell Name button is selected.
A combined name is now used for each variable, using the column headings with the row heading as a subscript.
Note that the action of detecting heading based on bold font is enabled through fxRender-Settings-Options. By changing these settings, you may also indicate headings using italics, operators (e.g. =, <) or any other character you choose.
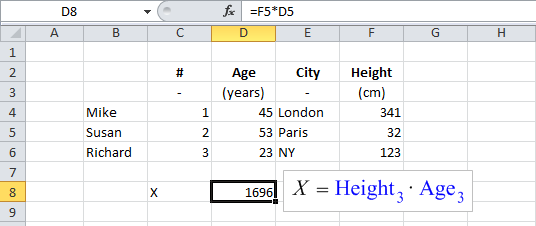
Here only the column headings have been bolded.
Although there are potentially row headings, fxRender recognises that the user has marked the top cells in each column as a heading (using bold in this case), so this takes preference over any other titles it may choose to use.
You can of course also bold just the table rows you want to used as titles.
In this instance it has exactly the same effect as the automatic title selection shown previously.